


Arizona is off to a hot start including wins away from home over Florida, UCLA, and Connecticut. Let’s take a look at a few things from the latter of those contests and then contemplate what we can learn from the stats so far this season.
UCONN Notebook
UCONN is extremely difficult to cover, as detailed by Jordan Sperber here (with an into from a familiar face). They have a ton of off-ball action and Ivan Kharchenkov did a great job navigating around screeners while covering Alex Karaban in this game. You can see he is staying aware before the action begins, fighting to get through the screen, and recovering without fouling.
Near the end of the UCLA game, Arizona ran the same play twice in a row to space the four-man out and run a 1-5 pick-and-roll. The Cats came back to that action late versus UCONN, with Motiejus Krivas getting a rebound stick-back to put them up for good.
Coach Lloyd won his first challenge of the year, an out-of-bounds call on a rebound with 6:39 remaining in the game.
If you haven’t read my article on NBA timeouts and challenges, here is the breakdown of the NBA expected value of a coach’s challenge, with explanation in the linked article.
I will be studying the difference this year between NCAA and NBA challenges. For one, NCAA coaches have three second-half timeouts while the NBA has an intricate system of mandatory timeouts. This seems to be deterring NCAA coaches from challenging as much as they probably should.
Coach Lloyd earned the Cats about a point on average with his challenge. With less than 7 minutes to go, this was a good use of a challenge. However, there was nearly a better case earlier in the game.1
With 6:43 left in the first half, Solo Ball kicked his leg out on his three point attempt to try to create contact. Had a foul been called on Anthony Dell’Orso, Coach Lloyd should have absolutely challenged.
Solo Ball is a career 82.4% free throw shooter so the value of his free throws would have been 2.472 points. Had this been a made-3-and-1, it would be the holy grail of challenges, in this case worth 3.824 points if won.
With the shot landing out-of-bounds in favor of the Wildcats, there was not much value in challenging. Although, Coach Lloyd never ended up using his second challenge (nor his first half timeout), so in hindsight, putting another foul on Ball would have been worth it.
Wildcat Analytics
It is still very early in the season and small sample size looms large. But with that being said, it is worthwhile to look at some early season trends. I’ll be using numbers from all five games unless they look meaningfully different if I exclude Utah Tech and NAU, in which case I’ll refer to games vs ranked opponents.
Pace - The Wildcats are playing at a pace of 69.5 possessions per 40 minutes. This is right in the middle of D1, so they are neither playing fast nor slow currently, although opponents may have had a big effect on that.
Points per 100 possessions - The Wildcats are averaging 118.0 points scored and 96.4 points allowed (112.2 and 105.5 vs ranked opponents). All of these numbers are better than the national average (either scored or allowed) but in a balanced way.
For instance, 112 points scored is the 63rd percentile while 105 is in the 36th. All this is to say, the Cats seem to be winning slightly on both the offensive and defensive end.
All stats and graphs in this article are sourced from cbbanalytics.com.
Offensive Four Factors
Effective FG% - Against the three ranked opponents, Arizona’s EFG% is 50.6%, again 50th percentile. However, the breakdown of the shots is far from average, which we will get into later.
Offensive Rebounding - The Cats are rebounding over 38% of their missed shots this year, putting them in the 90th percentile nationally.
However, they are currently in the 46th percentile in 2nd chance points per possession, indicating they may be having some trouble converting those offensive rebounds (17.8 per/100, 70th percentile).Turnovers - Arizona has turned the ball over on almost 16% of their possessions, slightly worse than the national average.
Free Throw Attempt Rate (FTs/FGs) - The Wildcats FTR was nearly 0.46 in their games against ranked opponents (0.41 overall), putting them in the 86th percentile in D1.
They are making their free throws at 77.3%, also in the 86th percentile.
Defensive Four Factors
Effective FG% - Ranked opponents have shot 50.0% EFG% against the Cats, slightly worse than the national average.
Defensive Rebounding - The Cats are rebounding over 72% of opponents missed shots, putting them at about the 74th percentile nationally.
Turnovers - Ranked opponents turned the ball over on 14.7% of possessions, a bit below the national average and resulting in them having almost 1 more possession per game that ended in a shot than the Cats.
However, the Cats are scoring 21.7 points-off-turnovers/100, near the 60th percentile. That would indicate they are doing a good job on D-to-O transition on live ball turnovers potentially.Free Throw Attempt Rate (FTs/FGs) - The Wildcats have put opponents to the free throw line at a FTR of about 0.30, about the 80th percentile best (lowest) nationally. They also commit fouls at the 82nd best (lowest) percentile, 23.6 fouls / 100 poss.
Shooting Breakdown
In sports analytics, rate statistics (e.g., the number of three-pointers a team takes) generally stabilize with a smaller sample than percentage statistics (e.g., the percent a team shoots on three-pointers). Therefore, Arizona’s shot diet may be the thing we can be most confident in at this point.
3FG - Against ranked opponents, the Wildcats are attempting 16.4 threes / 100 poss, 20.0% of their shots. That is the 0th percentile against all D1 teams full season averages.2
The ones they have shot have gone in 43.9% of the time vs unranked opponents but only 29.4% of the time vs ranked opponents.
Of the eight players in the rotation, three essentially will not shoot threes right now: Motiejus Krivas, Tobe Awaka, and Koa Peat. Anthony Dell’Orso is a career 37% three-point shooter on decent volume (~4 per game), whereas Jaden Bradley is a 36% shooter on low volume (~1 per game)
The question is, can any of the other three freshmen shoot well enough to help balance the Wildcats offensive attack.
Ivan Kharchenkov had played in the German professional leagues for parts of the last four years. He has shot 104/392 (26.5%) from three in that time, without statistical improvement year-over-year.
Dwayne Aristode played only one year at Brewster Academy before missing his senior season due to injury. But he did shoot 44/111 (39.6%) from three in his junior season.
Brayden Burries shot 141/396 (36%) from three in his two seasons at Roosevelt High School.
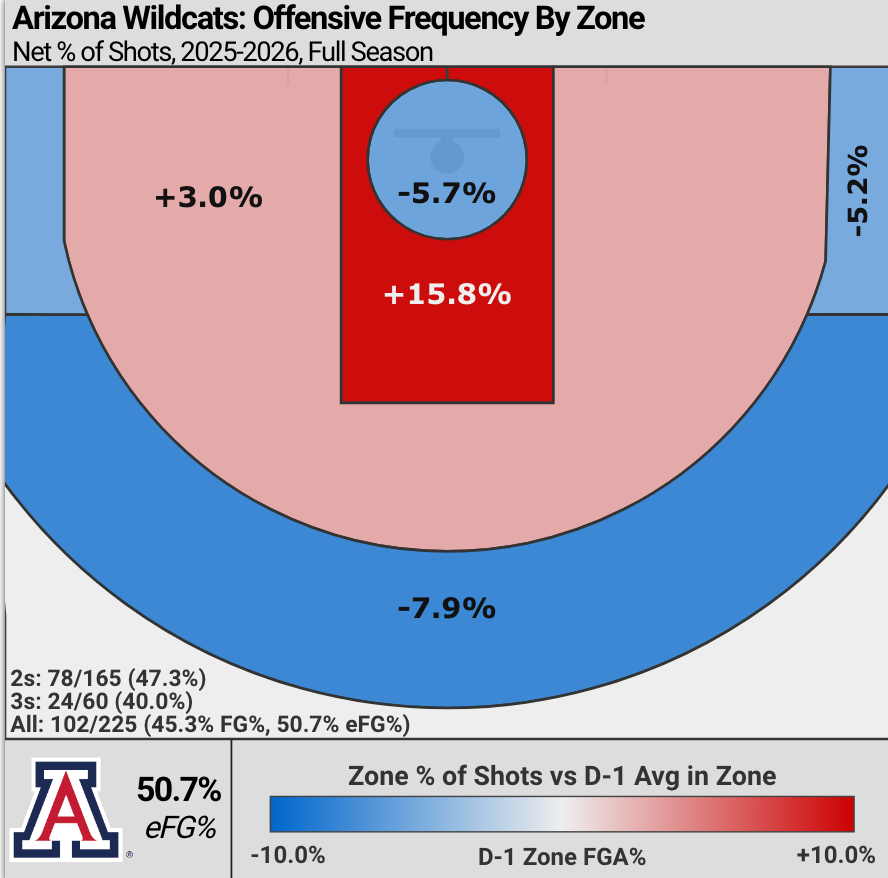
Both Burries and Aristode shot 77% from the free throw line in high school while Kharchenkov was 65% in Germany.3 Sometimes free throw shooting can indicate the ability to improve from beyond the arc.2FG - Naturally, if they aren’t shooting threes, the Cats are shooting twos at a high clip, statistically in the 96th percentile of 2FG / 100 poss. But it is worth noting where inside the arc they are shooting from.
As you can see in the chart below, which graphs the percentage of shots coming in each zone (transition and putbacks excluded) compared to national average, they are shooting a considerable amount more shots away from the rim than most teams.4
Takeaways (a.k.a. “The Wildcats are…”)
Awesome on the glass on both ends of the floor.
Getting to the line and making their free throws, while avoiding fouls on defense.
Shooting threes at a rate that is more befitting of the last time they went to the final four than 2025.
Going to need Brayden Burries and Dwayne Aristode to continue to improve as they will be counted on as the season progresses.
Next up: Home vs Denver on Monday November 24th, 8:30PM MST.
Editor’s note: After publishing, I realized I got a little too excited about this type of potential challenge, as it is one of the best options in the NBA. However, I have since remembered that it is not challengeable in college. You can read my opinions about that in the next article.
The Cats have shot 25.6% of their field goals from three across all 5 games, good for the 2nd percentile. The lowest in the nation is 22.8% as of Sunday 11/23/2025 afternoon.
He is 7/8 this season though.
Their defensive chart actually looks very similar as they have great rim protection.