


Regular season NBA basketball returns Tuesday! To close the offseason, let’s finish our review of previous years’ coaching decisions. This is the second in a two-part series on in-game strategy using insights gleaned from the new NBA Coach’s Decision Dashboard. Last time, we took a look at how teams have been using timeouts, and this week we go one step further, digging into the data on challenges.
About a year ago, I wrote an article introducing the risk/reward proposition that is the NBA coach’s challenge system. While the numbers used in that introduction were rough estimates, I still think the article gives a nice overview of the thought process a coaching staff should go through before they twirl their finger at the officials.
NBA challenges are an opportunity assessment. Coaches must consider both the likelihood and reward of winning the challenge. A challenge of a foul called on a three-point shot has a much larger reward when a ruling is overturned than a challenge of an out-of-bounds call does. Coaches must also consider the cost of a lost opportunity for a future challenge, which is often a harsher penalty than the lost timeout. For that reason, a call in the first quarter may not be worth the risk of challenging and potentially being without one for the rest of the game. Even if correct both times, a team has a maximum of two challenges.
Just like timeouts, challenges are a tool in a coach’s toolbox. Teams should be looking to maximize the value they can harvest from their challenge allocation every game. Ideally, we’d like to be able to answer the question “which teams use challenges well and which teams use them poorly?” While we still lean more toward observation than evaluation in this article, an attempt is made to quantify the benefits gained from each challenge.
My Challenge Insights So Far
Disclosure: Some of these were discovered with help from AI.
Usage
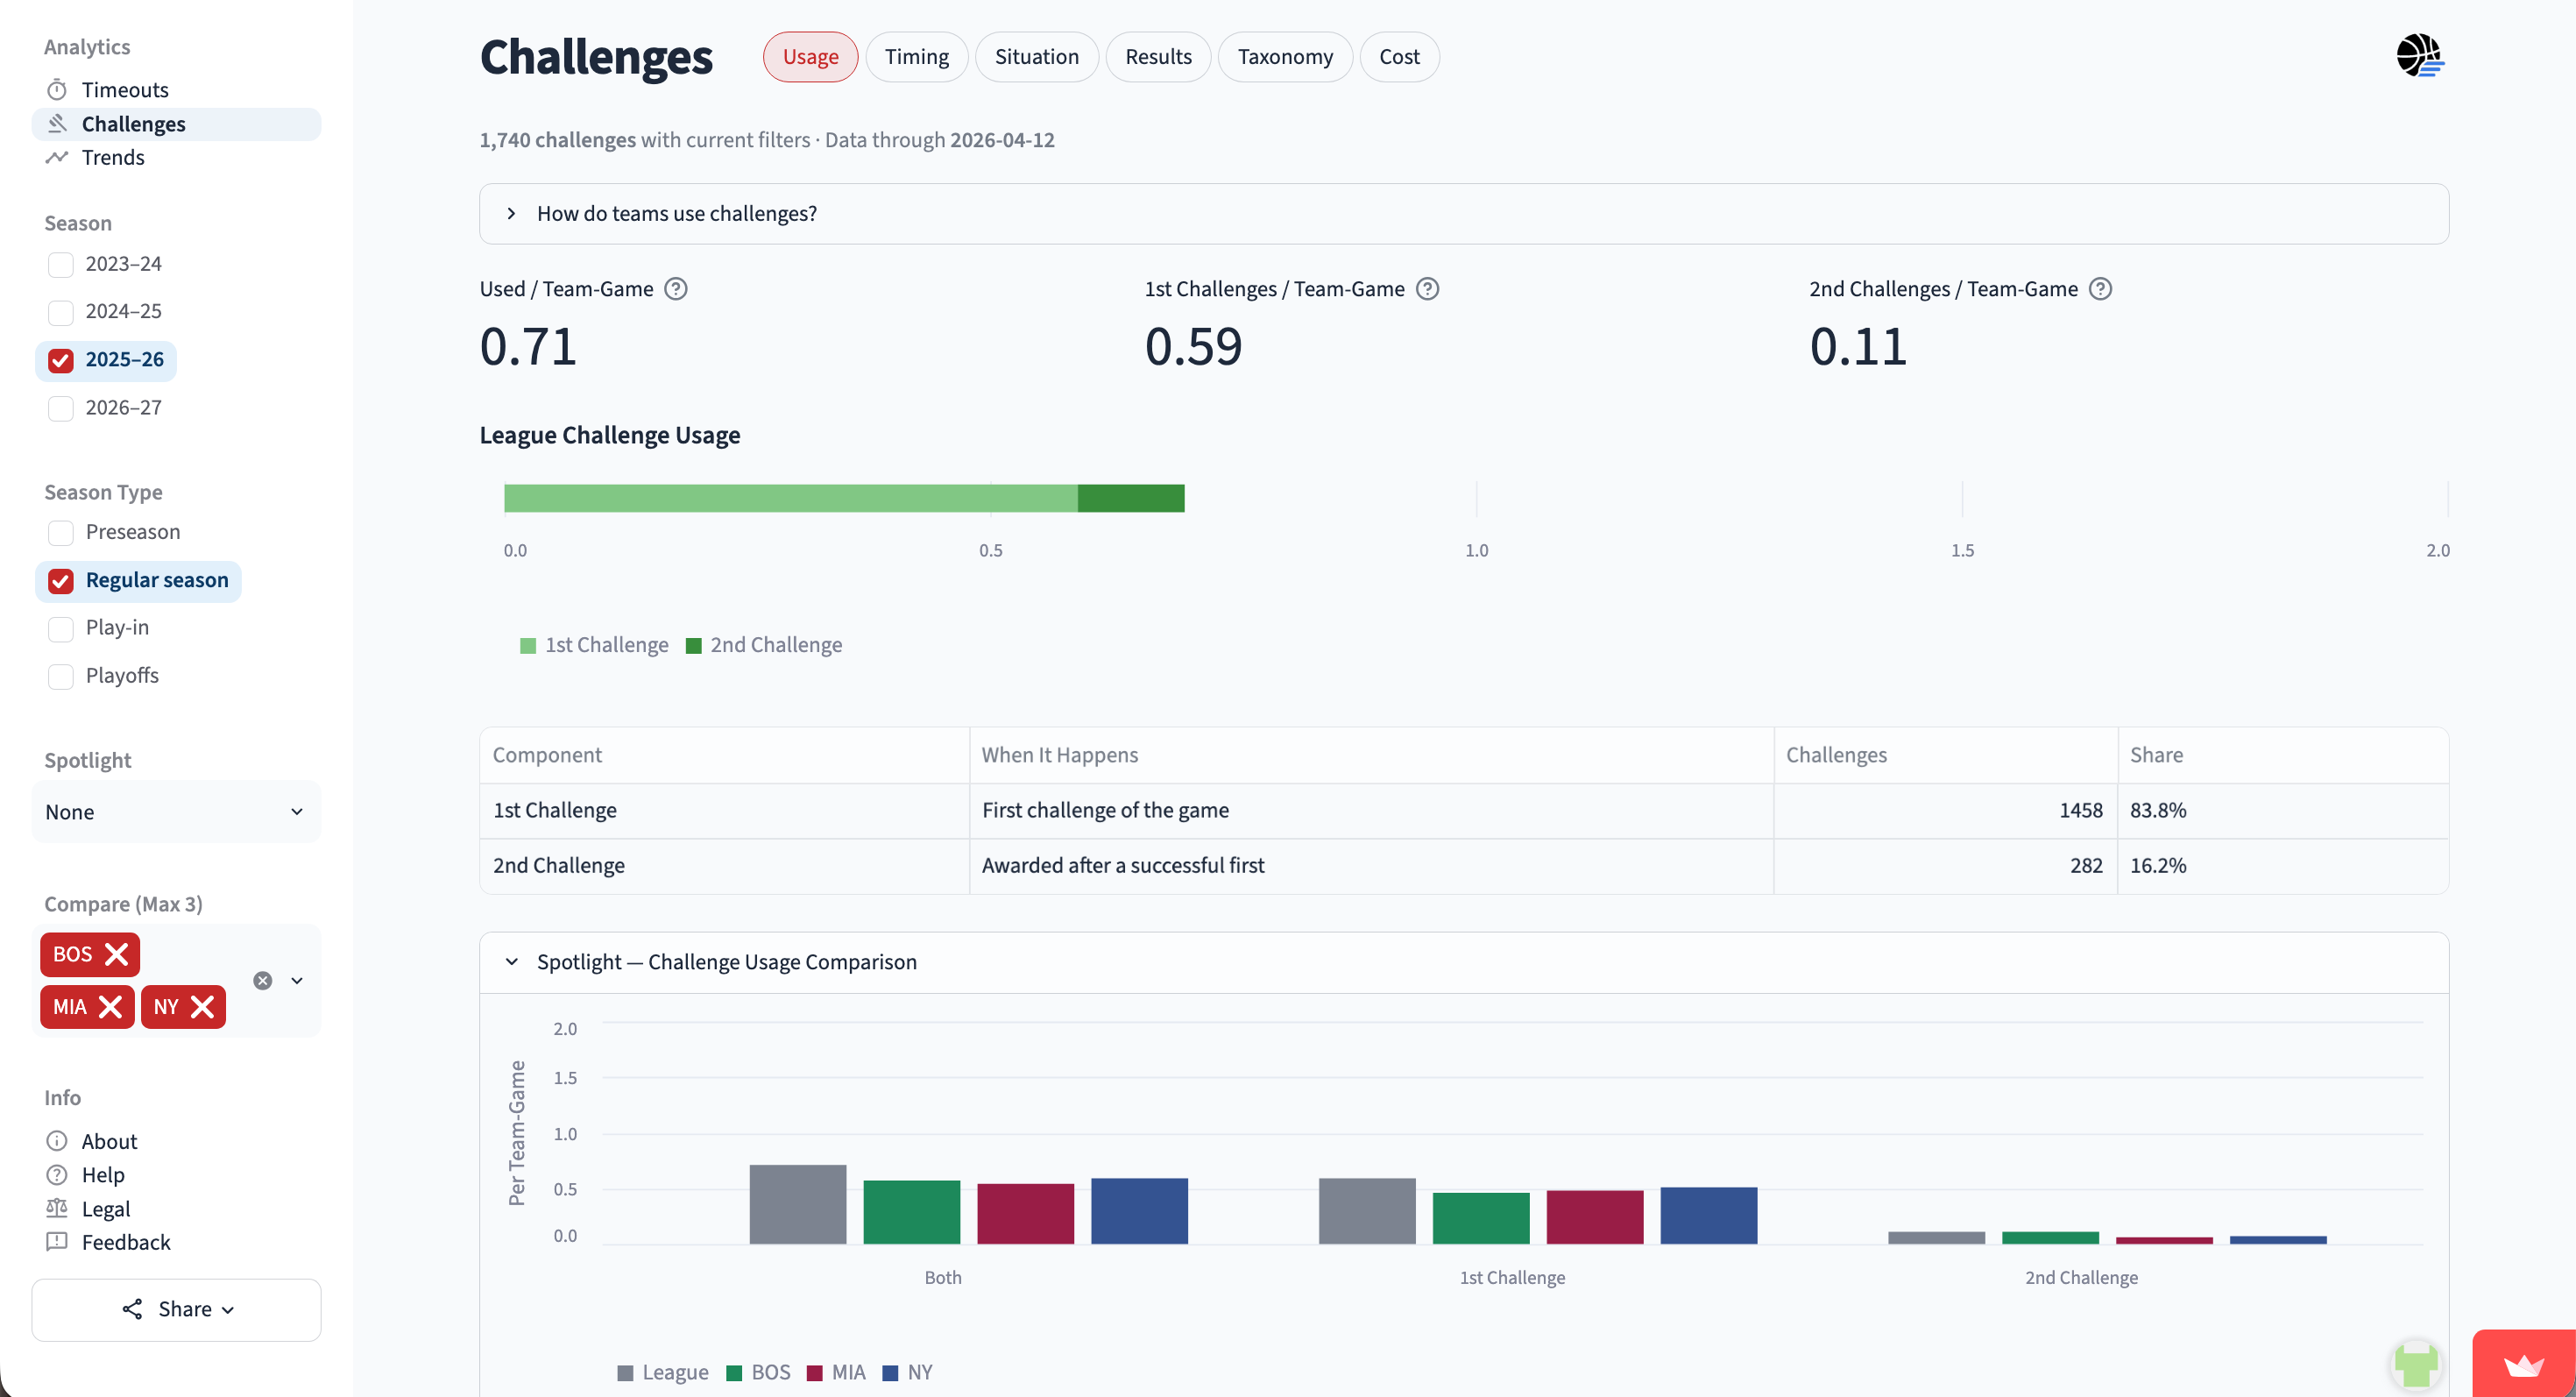
Teams are granted one challenge per game and earn a second if they are successful on their first. In the 2025-2026 regular season, teams averaged 0.59 1st challenges per game and 0.11 2nd challenges per game.
Oklahoma City was the most frequent challenger at 1.04 challenges per game, including 0.83 1st challenges. Portland, who was second overall, led in 2nd challenges at 0.24 per game.
Chicago used the fewest challenges, only 0.30 per game. The Bulls, along with the Pacers, who used the second fewest overall, had a league-low 0.01 2nd challenges per game (1 each, both successful).
This is an interesting finding given that both Chicago and Indiana were top-5 in timeouts used per game, an indicator of a weak correlation between timeout and challenge usage.
Timing
1st challenges don’t occur until the 3rd quarter on average, with a mean time of Q3 8:25. The mean time for 2nd challenges was Q4 8:41.
In addition to challenging the least frequently, Chicago challenged the latest of any team, with their 1st challenge occurring at Q3 3:20 on average. Memphis (Q2 0:54) and Washington (Q2 0:44) were the only teams whose 1st challenge occurred in the first half by average time.
Only three teams had an average 2nd challenge time before the fourth quarter: Atlanta (Q3 3:46), Detroit (Q3 3:40), and Utah (Q3 2:11).
Challenges are more frequent as the game progresses, with the most usage in the final three minutes of the game. This 3-minute bin accounts for 12.7% of all challenges. Of 2nd challenges, 29.5% occur in this time band.
Teams are far less likely to challenge in the first three minutes of any quarter. There are noticeable drops from the end of one quarter to the start of the next. For context, Q2 3:00-0:00 saw a 7.0% share of challenges while Q3 12:00-9:00 saw only 4.9%.
Situation
The above pattern is most likely attributable to the timeout cost of a challenge. If the mandatory timeouts for the quarter have not been taken yet, a challenge results in a mandatory timeout, even when the ruling is overturned due to a successful challenge.
On successful 1st challenges, 60% still resulted in the challenging team being charged a timeout.
Teams are averse to taking the first mandatory timeout of a quarter via challenges. They are less hesitant to use a challenge that will be the 2nd mandatory timeout of a quarter and are most emboldened to challenge during the voluntary timeout phase, where they did so 1.94 times per 100 minutes spent in that state.1
Preemptive 1st mandatory timeouts occurred at a rate of 1.13 per 100 minutes, with Away First timeouts at 1.26.2 Away First being higher is somewhat surprising, as I would argue it’s a higher cost.
Preemptive 2nd mandatory timeouts occurred at a rate of 1.83 per 100 minutes, with Double Mandatory timeouts at 1.55. This is in line with my expectation since Double Mandatory is a higher cost.
These rates were far lower for 2nd challenges than for 1st challenges when normalized for eligible minutes. Teams generally look to save that final challenge.
As for success, 1st mandatories were the most successful, followed by 2nd mandatories and then voluntary, which is inversely correlated with their frequency of use.
For reasons I struggle to understand, Away First (74.2%) were more often successful than Preemptive 1st Mandatory (69.2%) and Preemptive 2nd Mandatory (66.3%) were more successful than Double Mandatory (63.3%), despite each having more frequent usage than their counterparts. Challenges risking voluntary timeouts were the least successful (58.6%).
Nearly all of these categories were more successful as 1st challenges than as 2nd challenges.3 Perhaps this is due to a willingness to try a 2nd challenge near the end of the game on questionable opportunities.
Teams challenged most frequently when they had 4 timeouts remaining (371 challenges), but on a per-minute basis, they challenged most often with 2 timeouts remaining (3.14 challenges per 100 minutes).
Teams were most successful on challenges when they had 6 timeouts left (73.9%), just better than when they had all 7 timeouts. The success rate declined with fewer timeouts remaining, perhaps due to the effect of the time left in the game.
Taxonomy
There are officially three types of calls that can be challenged: goaltending or basket interference (GT/BI), out-of-bounds (OOB), and fouls.4 However, these break down into subtypes, and each of those can be further decomposed into specific cases.
For example, one case could be a call-on-the-floor of an offensive foul resulting in 0 points, 0 free throws, and the opponent’s ball, which was overturned to a post-review call of a defensive foul, 3 points, 1 free throw, and the resumption point of that challenging team at the free-throw line. If you can picture it, the official called a leg kick foul on the shooter, a call that was challenged by the offensive team, and changed to an and-1 on a made three-pointer.
Each case has an Estimated Point (EP) value, and the one described above would be worth 3.7995 points for the challenging team, the highest in our taxonomy. Our current EP methodology ignores effects on personal or team fouls5, looking solely at the points or free throws on the challenged play, as well as the expected value of the resumption point. To understand the EP methodology, please read the description here.
Unfortunately, there is a gap in the current method. Neither play-by-play data nor the official NBA challenge report includes enough information to diagnose every case. For example, let’s look at the reverse situation of our case above. The call-on-the-floor is an and-1 on a made three-pointer, challenged by the defense, and overturned to an offensive foul.
The NBA report shows an initial defensive foul and a final offensive foul call. The play-by-play data shows only the final call, an offensive foul. No voided events for the made three-pointer or defensive foul appear in the log. In reality, this challenge had that same super-high EP of 3.7995, but it is indistinguishable from other defensive foul calls-on-the-floor that were flipped to offensive fouls, including those that did not involve a shot or potential free throws because the team was not in the bonus.6
Both of these real-life instances are currently categorized as the defensive-to-offensive flip without a shot, which I believe is the more likely scenario among these two indistinguishable cases, giving both an EP of only 1.0910. There are multiple groups of indistinguishable cases that can be viewed by selecting “By Rollup” in the Taxonomy view of the Dashboard’s Challenges page.
I have some ideas to improve the estimation of these cases that I may implement in a later update to the dashboard, but am also crowdsourcing ideas. If you have any suggestions, please reach out directly or submit them here. Now for some taxonomy-focused insights:
While the above described case is tied for the highest EP in our taxonomy, we did not see any examples in our dataset. We did, however, see 2 instances in 2025-2026 similar to that case but where the call was changed to “no foul,” which has an EP of 3.00, the made three-pointer now standing.
A more common but still lucrative case, which we saw 24 times in 2025-2026, was an offensive foul changed to a defensive foul and-1 on a two-pointer (EP of 2.7995).
Multiple cases of successful challenges with an EP of 0.00 were recorded, the simplest being a foul that was wiped off but one that was not a shooting foul, was not involving the bonus, and did not result in a change of possession, and thus caused no change in resumption (opponent ball).
There were also “hollow wins,” successful challenges that garnered almost no benefit, like when a team challenges a foul and the call is changed to a foul on a different player on the same team.
Overall, offensive foul challenges were successful 52.6% of the time, while defensive foul challenges were successful 58.7% of the time. However, the average EP per challenge on an offensive foul was 0.91, compared to only 0.55 on a defensive foul.7
Loose ball fouls were more likely to succeed than either offensive or defensive fouls, at 59.6%, with an EP in the middle at 0.79.
Goaltending was one of the cases most susceptible to a successful challenge. These calls were challenged 30 times in 2025-2026 and overturned 21 times, a 70% success rate.
There are just very few opportunities to challenge these calls. There were 639 goaltending and defensive basket interference calls in 2025-2026, of which 4.85% were challenged.
Compare that to defensive fouls: there were 42,209 in the 2025-2026 regular season, and only 2.01% were challenged.
In a small sample, offensive basket interference was a risky use of a challenge, successful only 25% of the time (3-of-12).
Out-of-bounds calls where the opponent was initially awarded the ball were overturned 76.4% of the time, for an average EP of 0.86.
On 3 occasions, an OOB call on the offense was changed to a defensive foul on a missed three-pointer, a great result with an EP of 2.3641.8
Of the 130 unsuccessful OOB challenges, 24 backfired into a foul on the challenging team, with 13 sending the opponent to the free-throw line causing a negative EP for the challenging team.
Challenges where the initial call was a jump ball due to officials being unable to assign possession were successful 7-of-10 times, although only at an EP of 0.5455 per successful challenge.
Of the 3 unsuccessful challenges that were originally jump balls, all of which resulted in negative EP (backfires), the challenging team was assigned a foul in two of them.
Results
Challenges were successful 63.6% of the time in the 2025-2026 regular season with a 64.9% success rate on 1st challenges and a 57.8% success rate on 2nd challenges.
Of the three major types, OOB calls were the most successful (76.3%), followed by GT/BI (58.1%), then fouls (57.5%).
Challenges were more likely to succeed early in quarters, almost certainly due to selection bias in when coaches chose to challenge. Challenges generally got less likely to succeed overall as the game progressed, and were lowest in the final three minutes (48.4%).
Minnesota had the most successful challenges (55) with Indiana having the fewest (15).
Indiana somehow managed to also have the second-worst success rate (48.4%) ahead of only Dallas (42.9%).
New York led the league in challenge success rate at 77.1%.
The average EP per challenge league-wide was 0.72 points.
Utah was most efficient with its challenges at 0.89 EP/challenge and Dallas was least efficient at 0.49 EP/challenge.
Minnesota earned the most total EP (65.17) and San Antonio the least (19.24).
Memphis led with 13.46 EP on 2nd challenges, while Milwaukee, Dallas, and San Antonio all finished with 0.00 EP. Those three teams did not have a successful 2nd challenge all season long.
Cost
1st challenges accounted for 0.44 timeouts per team-game and 2nd challenges accounted for 0.11 timeouts per team-game. Teams retained their timeouts at a rate of 0.15 per team-game.
Of all timeouts, 10.3% corresponded with challenges (1,362-of-13,264).9
Chicago used the fewest timeouts to challenge, only 0.168 per game. Minnesota used the most at 0.841.
Phoenix retained the most timeouts through successful 1st challenges, 0.341 per game.
Trends
Challenges have increased significantly from 0.52 per game in the season ending in 2024 to 0.67 in 2025, and then 0.71 in 2026.
Challenge timing became slightly earlier as a side effect.
2nd challenges increased from 0.06 per game to 0.11 in that same timeframe.
The primary increase by call type was in OOB calls, which were 0.38 per game in 2024 and are now 0.56.
The retain rate of successful 1st challenges has dropped from 47.9% to 40.0% as coaches are more willing to challenge in the mandatory phase of quarters.
In 2023-2024, timeouts corresponding to challenges were statistically more likely to result from unsuccessful challenges. Since then, more charged timeouts correspond to successful challenges than unsuccessful challenges. While 2nd challenges make up a portion of this, the pattern also holds when looking only at 1st challenges.
Despite an increase in challenges, teams are seeing more success. In 2023-2024, there was a 58.9% success rate, which rose to 63.6% last season.
EP/challenge jumped from 0.62 to 0.72 between those years, and league-wide EP earned grew from 798.8 to 1245.1.
There is an upward tick in playoff challenges: 0.77 per game, versus 0.71 in the 2025-2026 regular season, and up from 0.63 to 0.75 over the three-year sample.
Challenge success remained near the same in regular and postseason in that timespan and was even higher in the playoffs than in the regular season in 2025-2026.
How to Use
This dashboard is designed to be far more interactive than previous apps I have released. Users can filter by season year or type (regular season, playoffs, etc.) and can choose from many different views to analyze challenges from multiple perspectives.
Spotlight: Choose a team to be the primary focus of the major KPIs and comparison charts. Up to three additional teams can be selected at a time for direct comparison.
Trends: Charts available on the Challenges page are compiled into year-over-year or season-type trend charts to see how patterns evolve over time or based on different types of games.
Notes
The dashboard can currently be used to analyze data from the 2023-2024 season onward. This was the year that the NBA modified the challenge rules to allow a second challenge for a team if the first was successful.
Data reliability depends on both ESPN APIs and the NBA’s official challenges log. Both of these have some reliability issues such that manual review of about 5% of challenges is required.
Most of the dashboard is updated with new data the day following a game; however, the Taxonomy and EP calculations require the NBA log, which is released weekly. Some preseason and play-in games lack this NBA log enrichment, as explained here.
I prefer the desktop version, but I have worked to optimize the mobile UI as well.
Feedback
What have I missed that would make this tool even better? Please provide feature requests or report issues whenever possible. I am sure there are many improvements to be made once people start exploring it.
I’ve also included the option to submit “Insights.” I am very excited to see what other people are able to find using this tool.
Please do share this with anyone else you think might be interested.
All of the calculations in the Situation view of the Challenges page take into account eligible team minutes, meaning minutes in which a challenge would cost that team a timeout (or, for a successful 1st challenge in the voluntary phase, potentially retain it). These are the timeouts being risked by the challenging team.
Double Mandatory was the exception: 1st and 2nd challenges were nearly equally successful, with 1st slightly ahead.
In the last two minutes of regulation and any overtime, goaltending or basket interference reviews are referee-initiated. The same is true of a block/charge foul call based on whether the defender was inside or outside the restricted area.
The EP methodology also currently excludes team- or player-specific statistics or state of game (game clock, shot clock, margin, etc.).
A different case, and therefore a different EP, is assigned if the team was in the bonus.
The defensive number is likely a little low due to the voided events gap, but there would be few instances of those, thus affecting the overall EP averages only slightly.
Beginning in 2024-2025, officials can add fouls proximate to the challenged play as a result of a review.
This does not count the 360 challenges that resulted in a retained timeout.