


Arizona handled business versus Abilene Christian, leading for 39:47 of game time, en route to a 96-62 victory. Their top eight players played at least 19 minutes, each tallying at least six points and a +/- of at least +9.
Something to appreciate about this team is how prepared they come to handle business every night. It would be difficult to pick out what has been their “worst” game so far this season. Arizona has not only won but beat the spread in most games this season. Only 26, 35, and 30 point wins against Utah Tech, NAU, and Denver failed to do so, primarily because the Cats got up too early too fast.
But the Wildcats have room to get even better…

Arizona’s Shot Profile Through Ten Games
As mentioned in a previous post, rate statistics like 3PAr, stabilize quicker that success metrics, like 3P%. In this case, “stabilize” means the stat will be more based on the signal than the noise. Here is a NBA stabilization chart created by Kostya Medvedovsky, creator of the metric DARKO.

Quick things to note:
3PAr stabilizes in less than four games, the quickest of any stat in this chart. You can tell whether a team wants to shoot threes or not very quickly.
Offensive 3P% takes over 68 games to stabilize. Even at the end of the college season, it is very possible that a team’s three point percentage was significantly lucky or unlucky.
Defensive 3P% is a crazy amount of luck.1 This is maybe the most surprising to non-stathead basketball fans. It is extremely difficult to make an opponent miss threes. Teams can try to not allow them if that is part of their defensive strategy but once they are being taken, it is really up to the shooter and the gods if it goes in, not the defender.
As has been well documented, Arizona’s 3PAr is near the lowest in Division 1. But something I do not hear discussed enough is where those shots are being reallocated.
Below are charts of Arizona’s proportion of attempts by region, broken down by the five games versus ranked opponents and the five games against other opponents.2 The +/- numbers are the difference compared to national averages for high-major teams.
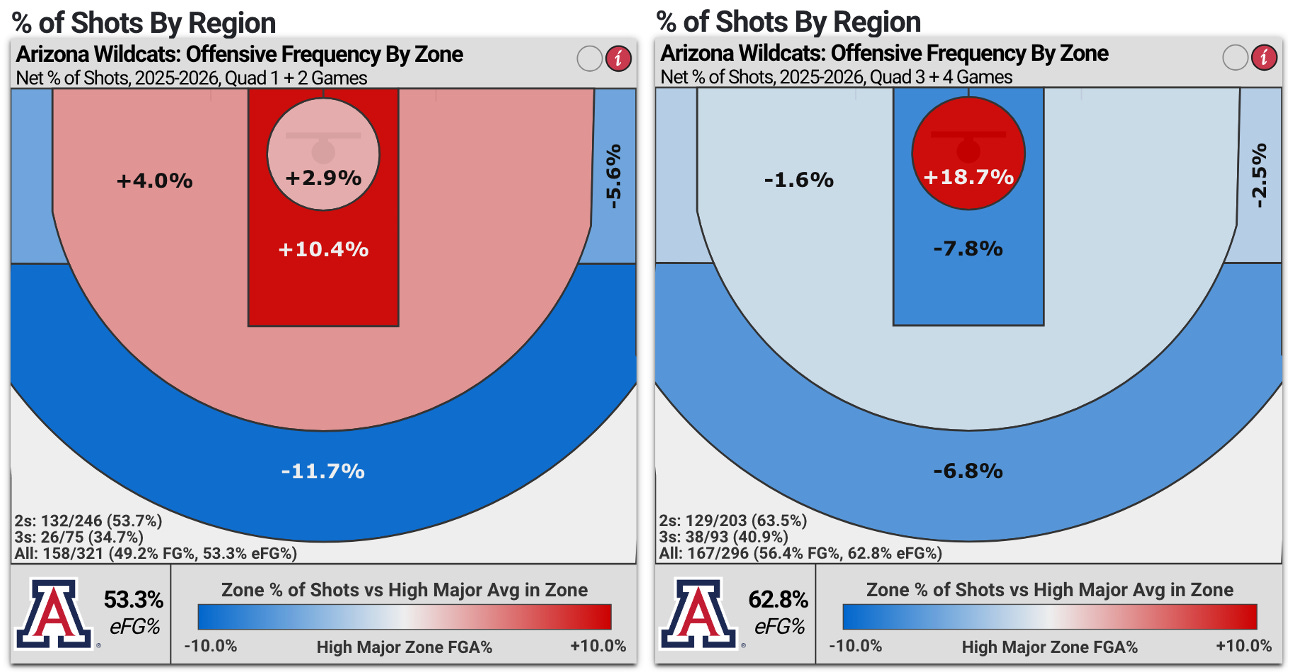
Against lower level opponents, Arizona passes up three point attempts in favor of getting shots at the rim. That’s great. But against tougher opponents, Arizona is mostly reallocating those looks into an increased number of midrange looks. That’s maybe a little more concerning.
On the bright side, other than corner threes, Arizona is shooting above average in each of these zones. Whether that is signal or noise will take some more time to suss out.
Takeaways:
In Quad 1+2 games, Arizona has shot 26-75 (1.04 points per shot) from behind the arc and 59-132 (0.89) from two away from the rim.3
For Quad 1+2 games, the high major average of shot attempts from two away from the rim per three point shot is 0.66. Arizona’s is 1.76.
Player Specific Shot Breakdown
If you are curious who is taking those long twos, the answer is pretty much everyone. Only Dwayne Aristode takes a smaller proportion (20.0%) of those twos than the national average (26.7%). That would certainly make one consider if this trend is scheme related.
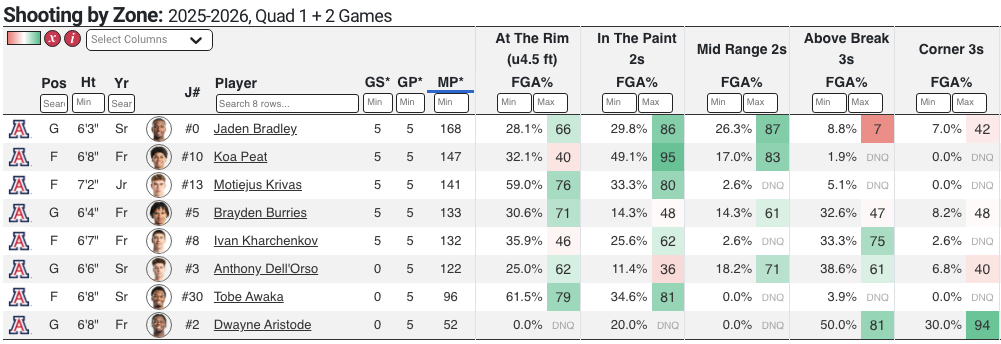
However, two players stand out: Jaden Bradley (56.1% of attempts) and Koa Peat (66.1%). This matches the eye test as I’m sure anyone who has watched a Wildcats game this year can picture either of those players pulling up and nailing a jumper.4
Peat does not have the range to step out to the three line yet. He has only attempted four on the season and I think its fair to say whichever NBA team drafts him will do so knowing that part of his game will be a project.
But as a potential lottery pick that does his work inside the arc, it is a yellow flag that he is below the forward average at getting to the rim.
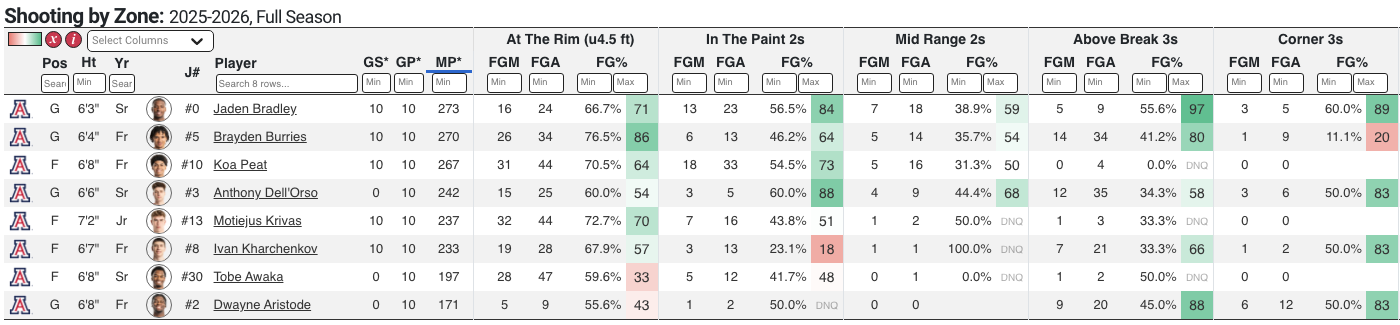
Bradley, on the other hand, has been an excellent, albeit resistant three point shooter.5 Actually, looking at the field goal percentages, he has been a good shooter everywhere.
In theory, the best value shots in basketball are at the rim and beyond the arc.6 But it’s easier said than done to “take more of those”. Sometimes the in-between looks are all that are available. And it’s nice to have guys like Peat and Bradley that are better than average when they have to take them.
However, any time one of those shots is taken, there should be an evaluation if there was a better opportunity.
If you look at the “midrange 2s” column, even though Arizona has four players at or above their positional national average, the shooting percentages are still not high enough to justify those shots except in late clock situations. The “In The Paint 2s” might be acceptable for Peat and Bradley, but seeing Burries, Krivas, Kharchenvok, and Awaka combine for 42 points on 54 attempts is noteworthy.
Arizona has been dominate so far through ten games. But there is still room to improve. As shooting percentages start to stabilize, the picture of the Wildcats’s optimal shot diet will become even more clear. And scarily for the rest of the country, the Cats can still become more efficient.
Next up: Neutral (Phoenix) vs San Diego State on Saturday, December 20th, 8:30PM MST.
Only defensive free throws take longer to stabilize, which basically means they converge to the population mean of all teams plus the possibility of a home court advantage or pace factor or some other very small effect. Clearly, defenders do not force opponents to miss free throws.
Courtesy of cbbanalytics.com
Across all ten games: 1.14 per three point shot, still 0.89 on twos away from the rim.
Percentiles are position-based in this chart, hence Peat’s 32.1% at the rim being 40th percentile for forwards while Bradley’s 28.1% at the rim being 66th percentile.
Small sample size. Switching to full season stats for shooting percentages.
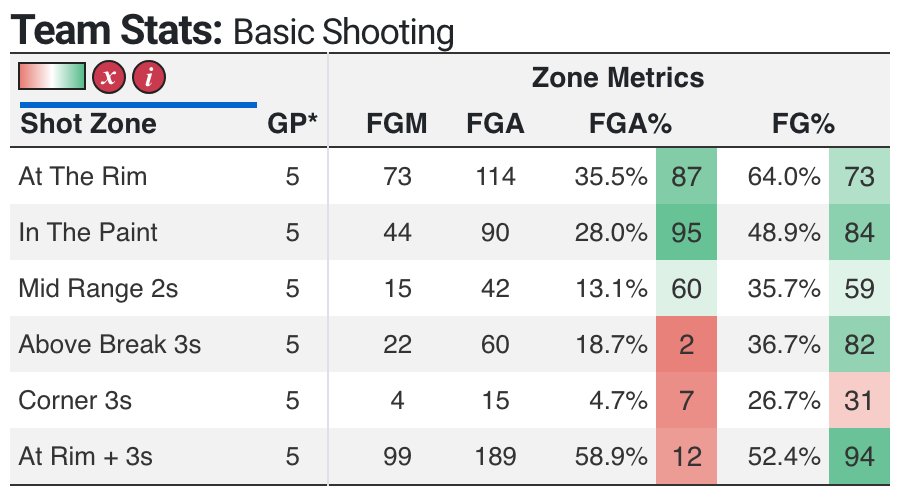
Arizona is in the 12th percentile nationally of shot proportion in these combined areas.