

Introducing NCAA Coach's Gamecast
A Second-Screen Application to See Games From a Different Angle
Tomorrow, championship week kicks into full gear as the Ohio Valley Conference punches its ticket to the NCAA Tournament, the first automatic bid of the year.
Today, I’m excited to share a tool I’ve been building to provide extra context to live college basketball games just in time for the postseason.
When I am watching basketball games, I tend to have a couple of windows open on my laptop. However, I have found that most gamecasts1 are designed primarily for viewing box scores and omit additional information that I would like to see conveyed.
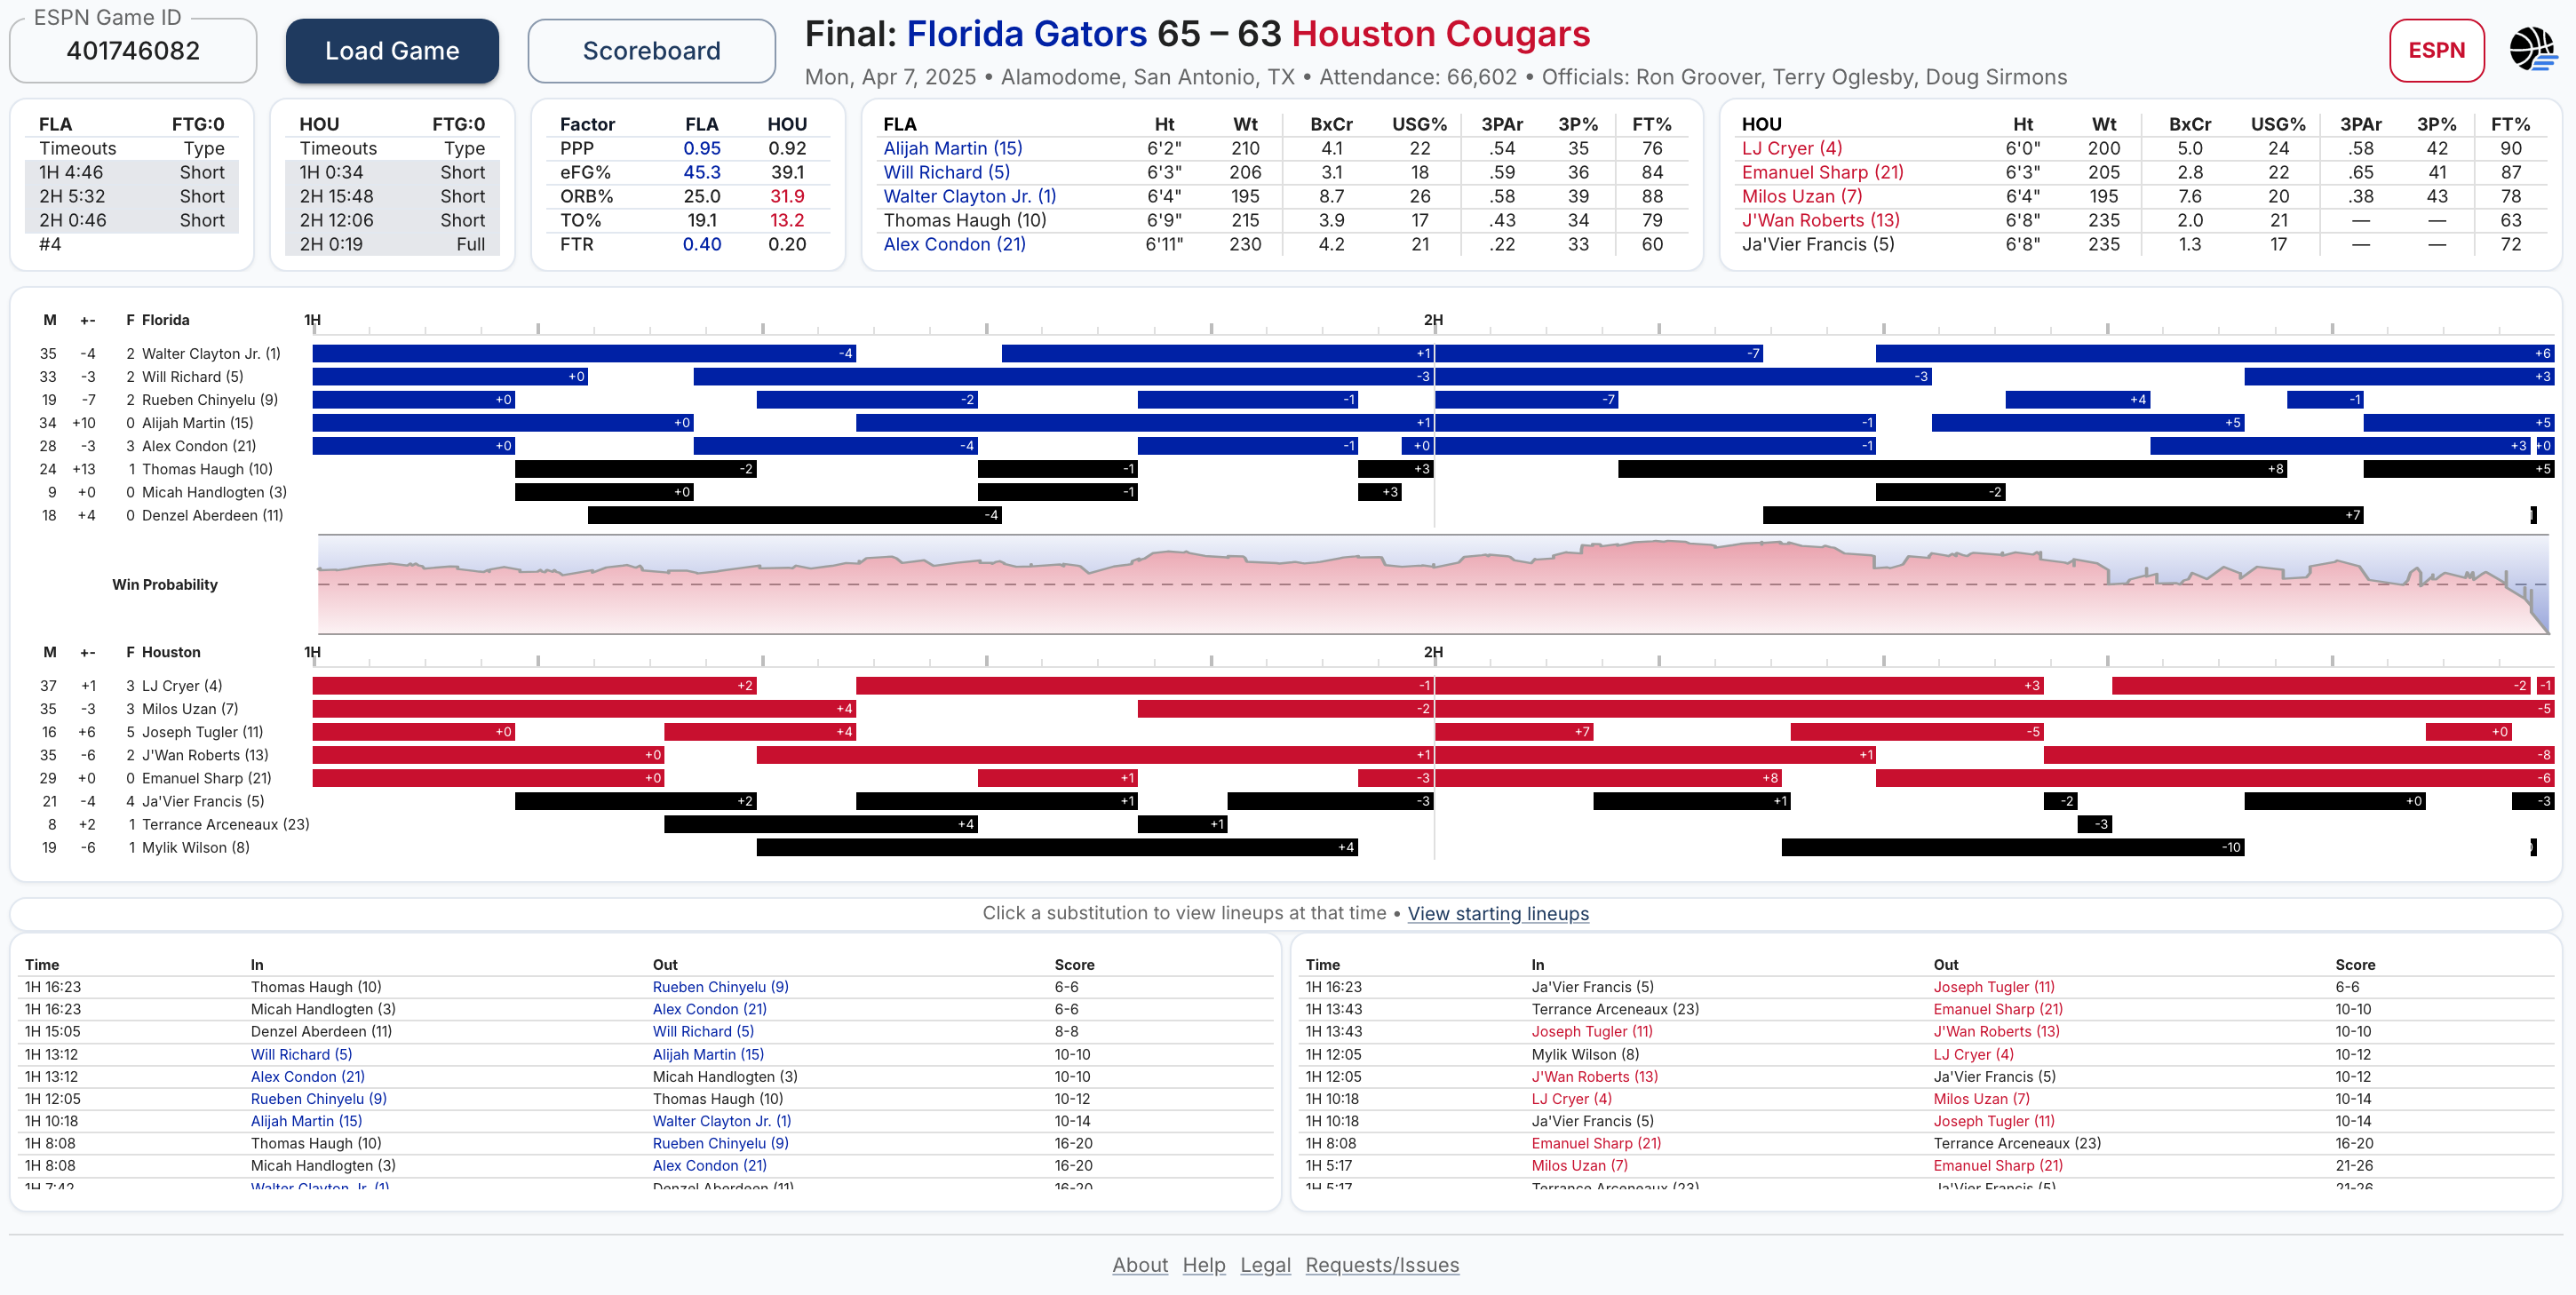
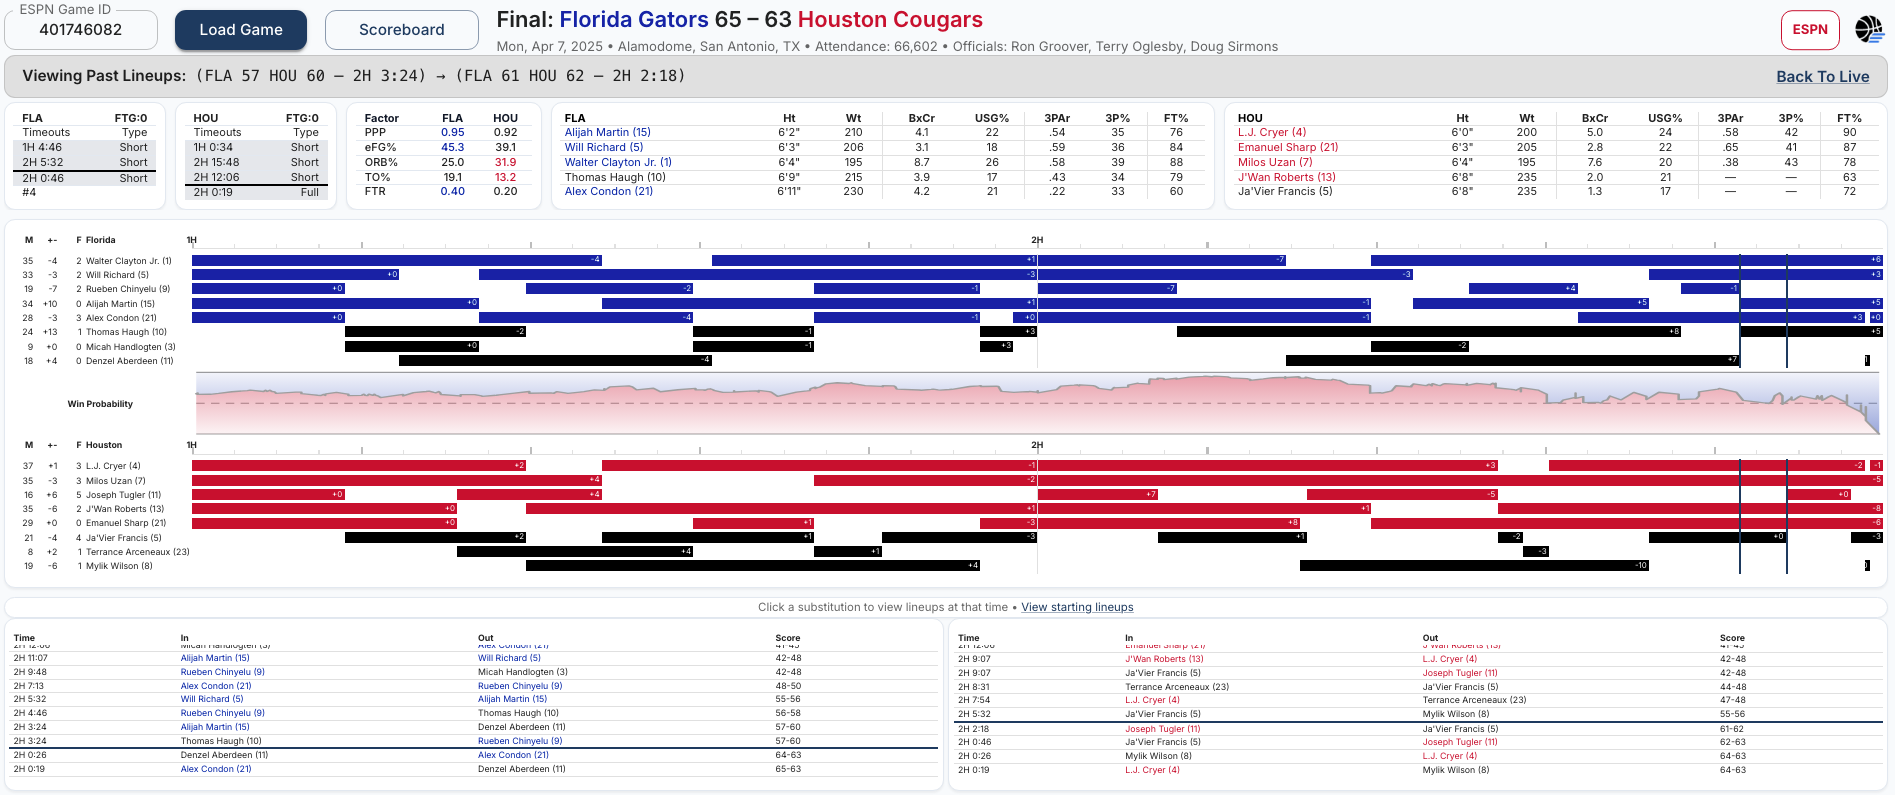
So, I set out to build a second-screen experience that offers a complementary perspective, one that goes beyond traditional statistics and typical announcer commentary. The design aims to reflect the mindset of a coaching staff, highlighting key considerations that influence in-game decisions. With that in mind, I’m calling it Coach’s Gamecast.
Lineups
From a coaching perspective, my most immediate consideration is the lineup currently on the floor. The lineup section of the app allows for quick comparison of matchups across teams.2
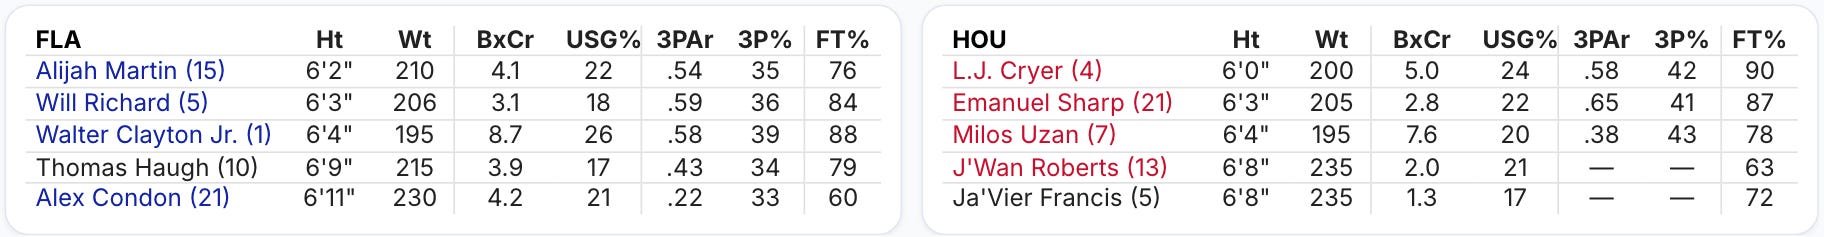
Each team’s lineup is sorted by size3, which provides a reference of expected defensive coverages. Users can also identify cross-matches (e.g., if Florida’s Will Richard is covering Houston’s Emanuel Sharp, but Sharp is covering Alijah Martin on the other end).
From there, the focus expands to player roles. On the offensive side specifically, additional questions arise: Does my lineup have enough creators (see box creation, BxCr) and possession finishers (see usage percentage, USG%)?
Does my lineup have adequate shooters to provide spacing? See three-point attempt rate (3PAr)4 and three-point shooting percentage (3FG%).
Especially at the end of games, I want to know the free throw shooting percentages (FT%) of the players on the floor as well.
Of course, the opposing team is making the same assessments, so their lineup requires equal attention. Using the dimensions outlined above, I aim to understand how their group compares, where each lineup holds advantages, where it is vulnerable, and how those strengths and weaknesses interact.
Are they playing a small-ball lineup against my backup center who cannot effectively punish it? What lineup did they go to when my best player left the floor? Identifying these moments is critical to understanding where tactical edges can be created or lost.
Rotations
A draft plan of substitutions is typically sketched out in advance. This pregame planning helps address lineup balance by allowing coaches to evaluate projected combinations ahead of time. From there, the plan can be adjusted as matchup issues emerge or as the flow of the game dictates.
The Coach’s Gamecast rotations section allows users to observe the substitution patterns of each team, while also quickly viewing minutes played, game plus/minus (+/-), and personal fouls to the left of the player’s name.
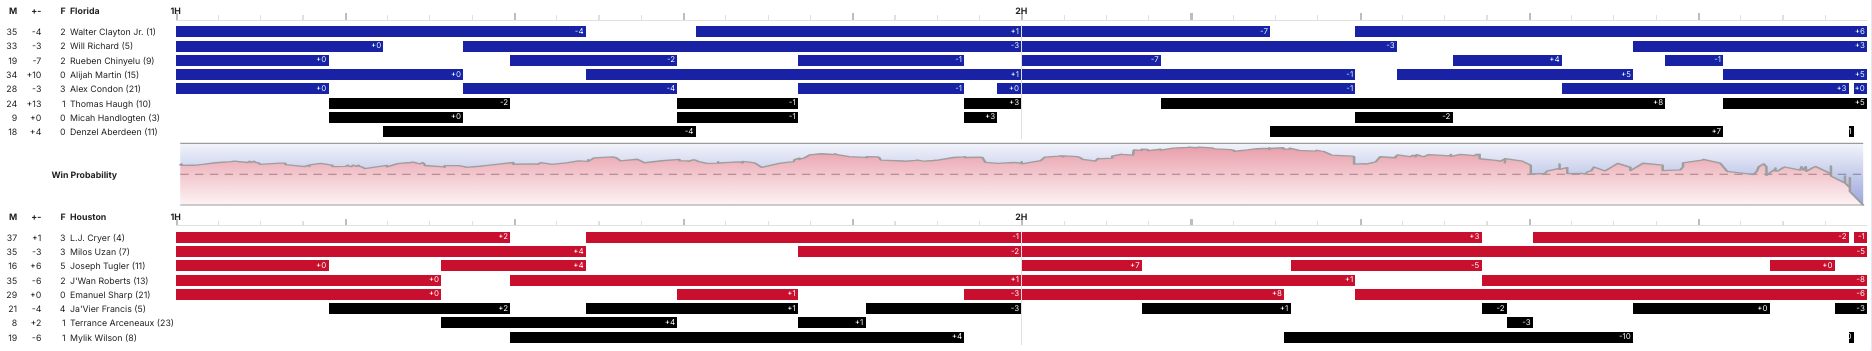
Personal fouls are often the biggest disruptor of rotation plans. If a starter picks up a third foul midway through the first half, carefully constructed substitution patterns may need to be abandoned altogether.
Throughout the game, coaches are also thinking ahead to the final minutes. Which five players are best suited to close, and how do I ensure they’re available and fresh?
If players have fouled out or are exhausted when it matters most, at least part of that responsibility falls on the coach. The challenge is to exploit matchups and avoid ever putting an unbalanced lineup on the floor, while also ensuring that key players receive adequate rest.
Finally, a coach might rarely have a precise sense of a player’s box score production in real time, but they likely do have a strong feel for how the team performs when that player is on the floor. If a player checks in for a four-minute stint and the team surrenders an eight-point lead, that stands out. The same is true for a player who brings energy off the bench and sparks a quick 6–0 run.
Coach’s Gamecast tracks each player’s plus/minus by stint to provide a proxy of this intuitive estimation. Between the two rotation charts is a graph of win probability by game time, another way to examine the flow of the game at each moment.
Substitutions and Rewind Mode
The bottom section of the app contains the substitution logs.
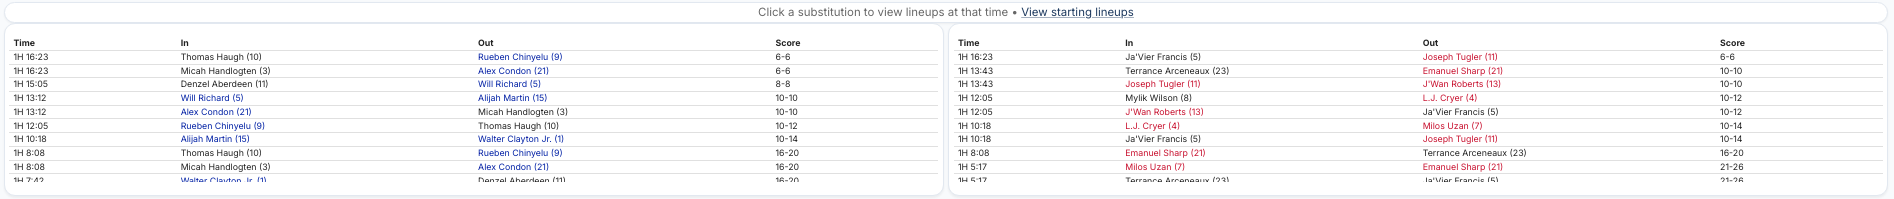
Clicking a substitution will put Coach’s Gamecast into “rewind mode,” displaying the lineups at that point in the game, the time and score at the beginning and end of that interval, and added visual cues to the charts and tables to highlight the timeframe that is being displayed.
This feature helps users review key stretches and analyze the matchups of every lineup that appeared.
Timeouts and Team Fouls
College timeout rules are not as complicated as those in the NBA, but they are still essential to the game state. I would like to add challenges to this section, but unfortunately have not found an API with that data included yet.5
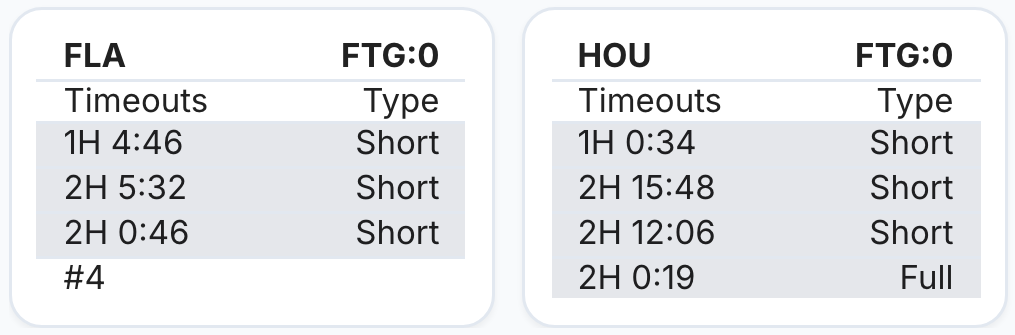
Coaches and players also need to be aware of the team foul situation, specifically whether either team is in or approaching the bonus. Fouls to give (FTG) are listed in the header row of the timeouts section.
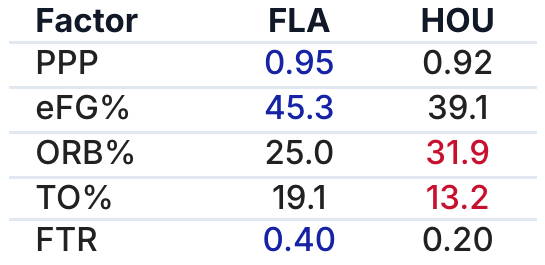
Four Factors
Finally, if you want a quick look at where a game was won and lost, take a look at the four factors table. Points-per-possession (PPP) gives a tempo-free evaluation of each team’s scoring. The subsequent metrics describe shooting, rebounding, turnovers, and free throw rate: the four areas you are most likely to hear a coach refer to when evaluating their team’s performance.
How to Use
Select a game from the scoreboard or team schedule pages.
Click any substitution to view previous lineups.
Read tooltips (hover) to learn more.
Notes
Data reliability depends on ESPN’s APIs.
Current APIs include substitutions for games from the 2024-2025 season onward.
Coach’s Gamecast currently refreshes data every 30 seconds for live games.
I prefer the desktop version so I can see all the elements simultaneously, but I have worked to optimize the mobile UI as well so I can still use the app while I am at games in person.
Feedback
What have I missed that would make this tool even better?
Please provide feature requests or report issues whenever possible. And please do share with anyone else that you think might be interested.
Thanks, hope you enjoy!
The one I have found that I like the best for Arizona games is straight from StatBroadcast.
I’m using the 2024-2025 NCAA Championship Game as the example for this article.
Rather than by jersey number, which is the standard.
The percentage of a player’s field goal attempts taken from beyond the arc.
If you find one, please let me know.