


Believe it or not, basketball season is just around the corner. Players reported for training camp last week, after a summer of development work with trainers and coaches. Front offices are in the final stages of building rosters after the draft and free agency. Coaches are preparing their offensive and defensive philosophies and schemes for the upcoming season, after a summer spent studying their previous year’s decisions and those of the rest of the league.
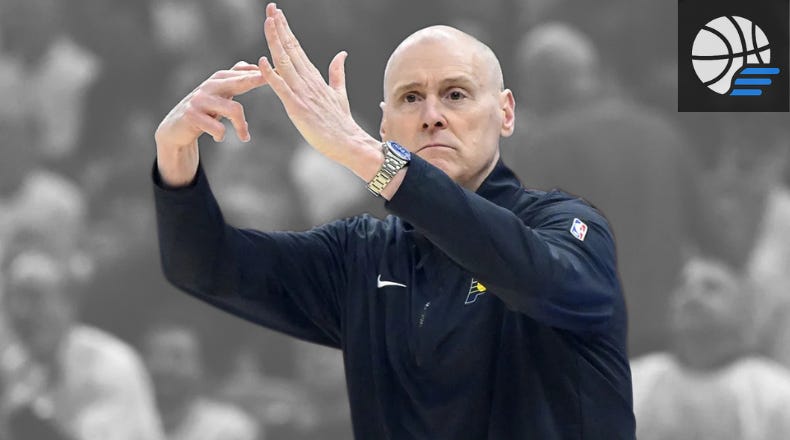
Just like players or GMs, there is a lot more to a coach’s work than we, the public, can see. But when it comes to games, the most visible action they perform is the one you see above. Timeout rules in the NBA are pretty complex, but that can be a good thing, as we touched on before:
Timeout rules in the NBA are complicated, which actually gives more opportunity for a coach to gain an advantage if they use them well. Coaches are forced to take timeouts in certain situations and also stand to forfeit timeouts if a minimum amount have not been used by specific time marks. Smart teams use timeouts in cases where they can cut opponent runs, set up after-timeout (ATO) plays, or challenge plays before they are forced to take or lose their timeouts.
In the spirit of offseason improvement, I spent the last few months creating a database of these decision points over the last three seasons and digging into the data to see how they are being used. Today, I’m happy to present the initial version of NBA Coach’s Decision Dashboard.
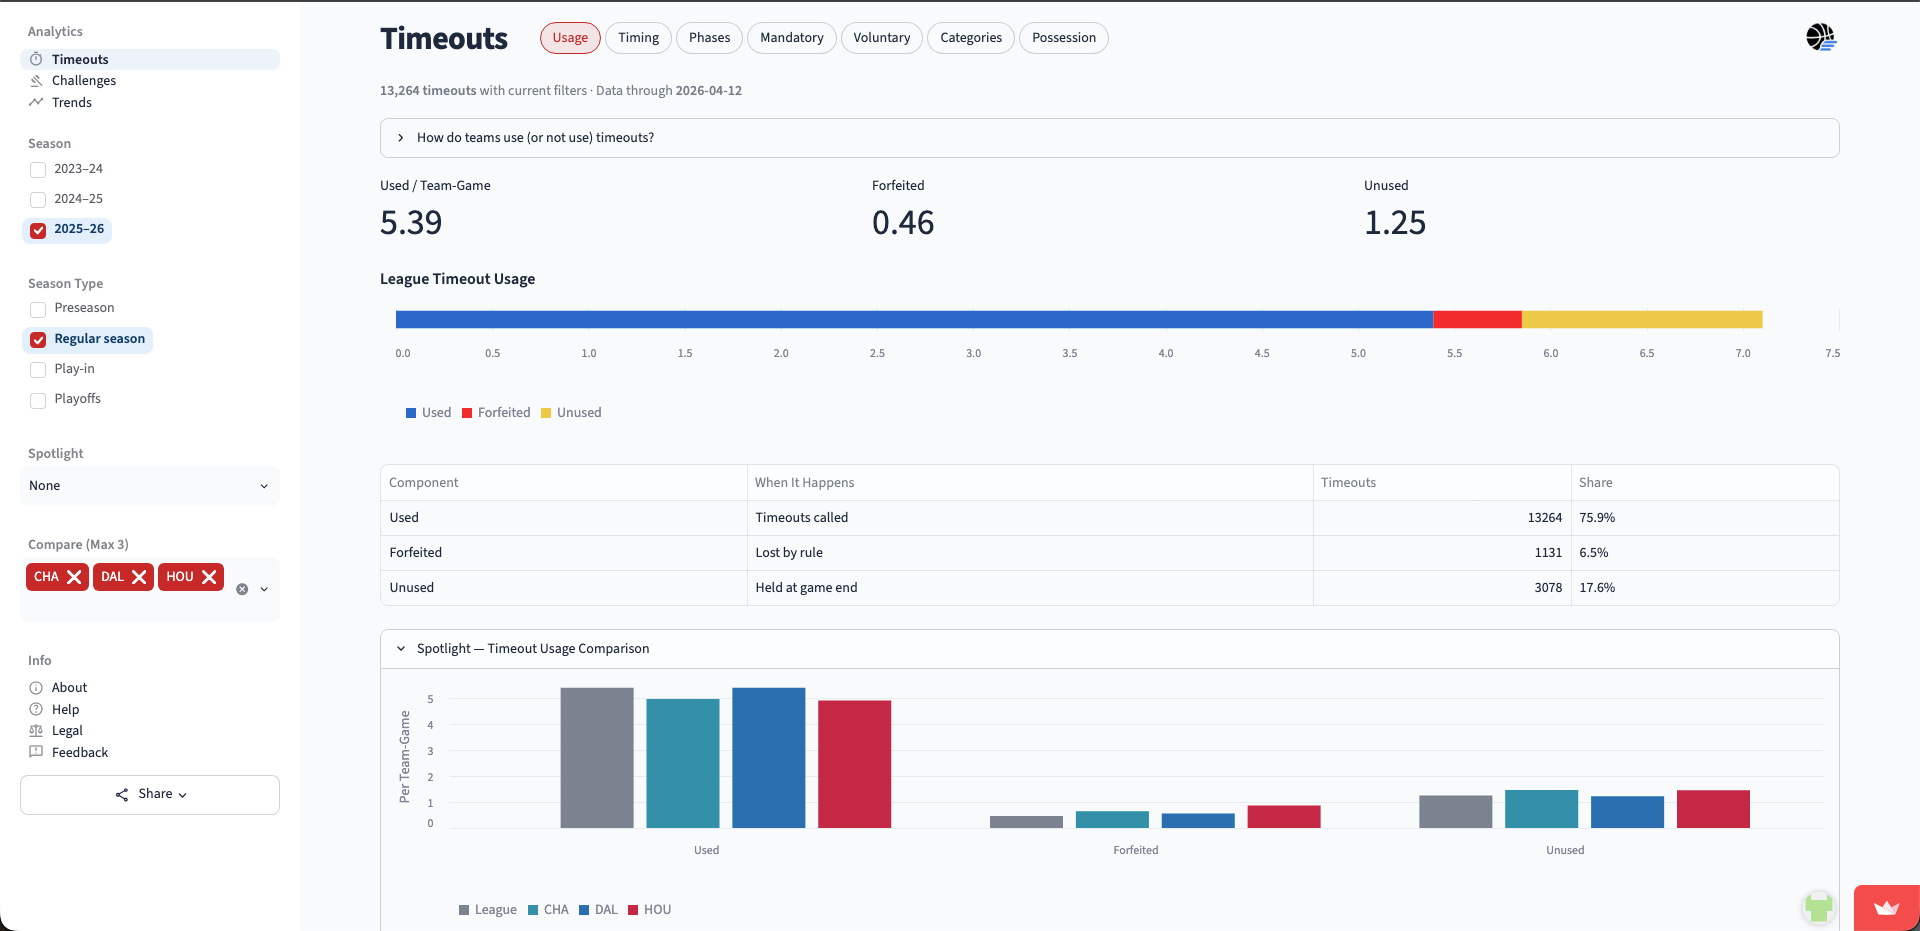
How to Use
This dashboard is designed to be far more interactive than previous apps I have released. Users can filter by season year or type (regular season, playoffs, etc.) and can choose from one of many different views to analyze timeouts from multiple perspectives.
Spotlight: Users can choose a team to be the lens that major KPIs and comparison charts highlight as the primary focus. Up to three additional teams can be selected at a time for direct comparison.
Trends: Charts available in the Timeout page are compiled into year-over-year or season-type trend charts to see how patterns evolve over time or based on different types of games.
Notes
The dashboard can currently be used to analyze data from the 2023-2024 season and after.
Data reliability depends on ESPN APIs, but it is fairly robust regarding timeouts.
I prefer the desktop version, but I have worked to optimize the mobile UI as well.
Feedback
What have I missed that would make this tool even better? Please provide feature requests or report issues whenever possible. I am sure there are many improvements to be made once people start to explore.
I’ve also included the option to submit “Insights”. I am very excited to see what other people are able to find using this tool.
And please do share with anyone else that you think might be interested.
My Timeout Insights So Far
Disclosure: Some of these were discovered with help from AI.
Usage
Teams are granted 7 timeouts per game but in the 2025-2026 regular season, used only 5.39 per game.
Better teams tend to end games with the most timeouts unused or forfeited midgame.1 68.8% of timeouts were forfeited by teams that were leading last season compared to 22.9% by teams that were trailing. 60.3% of unused timeouts were by game winners.
Detroit forfeited nearly a timeout a game in 2025-2026 while Boston has forfeited over a timeout a game over the course of the past three regular seasons.
Boston has also used by far the fewest timeouts over the three-year span (4.55), while Washington has used the most (6.03).
Despite being one of the weaker teams, Utah used the fewest timeouts in the league last year (4.73), finishing each game with an average of 1.60 timeouts still in-pocket. They have been well below league average each of the last three years, second only to Boston. It’s probably worth noting here that the Jazz were fined by the league for other forms of tanking back in February.
Indiana used by far the most timeouts in 2025-2026 (6.33). While this makes sense for a team that trailed in most of its games, the Pacers were also high-volume timeout users the prior two years when they were a much better team and are second in the league overall in timeouts used in the past three years.
Timing
Of those forfeited timeouts, 23.5% came at the end of Q3 last season, with nearly all the rest coming at or near the Q4 3:00 mark. There were 3 cases where teams forfeited a timeout at the end of regulation of a game that went into overtime.
Indiana and Washington did not forfeit a single timeout heading into the fourth quarter in 2025-2026. To our point earlier, Indiana has only 4 cases in the last three years combined, tied for the fewest with Toronto.
Teams are most willing to take early timeouts in Q4, followed by Q2, Q3, and finally Q1, where coaches are least willing to burn one straight away. There were 9 timeouts taken in the first minute of a game in 2025-2026 and 4 cases where two timeouts had been used in the first three minutes.
The team most willing to use a timeout early was Utah who took the Q1 first mandatory timeout at an average clock of 8:11. Miami was most willing to let play continue, stopping it for the first time in the game at 6:47.
Chicago led the league in times taking the first timeout (53 out of 82), while Minnesota did so the fewest times (28 out of 82).
The most common minute of a quarter for a timeout: 6:00-6:59 followed by 2:00-2:59, the time slots most often related to teams being forced into a mandatory timeout.
The final minute of the game; however, is predictably the most frequent minute overall, although only at 0.384 per game.
Next most frequent was Q4 3:00-3:59, where teams are about to forfeit a timeout. Interestingly, the other forfeit point, the final minute of the 3rd Quarter, was very low.
Phases
Each quarter has two mandatory timeouts. If one team takes the first two timeouts of a quarter, the other team is off the hook.
Detroit dodged the most mandatory timeouts in 2025-2026, taking only 3.57 per game while Washington doubled up the most, taking 4.62 per game.
Over the last three years, Washington stays the most with Boston the least.
Minnesota uses the second fewest mandatory timeouts. Most teams with that profile also use very few voluntary timeouts after both quarterly mandatory timeouts have been taken. However, that wasn’t the case with the Wolves who lead the league in voluntary timeouts per game (1.79) in the last three years. They finished 2nd in 2025-2026, only behind Indiana.
At 30.9% voluntary timeouts in 2025-2026, Minnesota led the league, whose average is 24.9%. The fewest, at an incredibly low 13.6%: Utah, of course, who took only 0.63 voluntary timeouts per game. Next closest was Brooklyn at 1.04.
66.7% of voluntary timeouts came in the fourth quarter.
Categories
When NBA Coach’s Gamecast released in April, I introduced the concept of categorizing mandatory timeouts into different types. Ideally, an opponent would take both of the mandatory timeouts early each quarter, leaving seven opportunities for voluntary timeouts to be used whenever best suited.2
But even mandatory timeouts are not all the same. A double mandatory timeout, the second of consecutive mandatory timeouts in a quarter is what frees up an “extra” timeout as described above. An away first timeout defines the first mandatory in a similar way, letting the home team off the hook from being the first team charged a timeout at 7:00 in the quarter.
Even taking a timeout when scheduled for the next mandatory breaks down in those that are preemptive (before the deadline), just in time (after the deadline, during a live ball), or forced (after the deadline, during a dead ball). The latter is the only instance where a team does not choose to take a timeout, but it is charged to them anyway.
Teams allowed themselves to be forced into timeouts on 18.2% of 1st mandatory timeouts and 19.7% of 2nd’s in 2025-2026.
Q1 numbers were 28.4%/31.1% and they declined each quarter to Q4 11.8%/9.2% respectively.
Houston was hit with the most forced timeouts, 28.0% of the 1st mandatory timeouts and a whopping 37.8% of their 2nd’s.
Toronto was least willing to wait to get hit by a forced timeout. Only 9.7% of their 1st mandatory timeouts were forced and only 6.7% of 2nd’s.
41.2% of the time, the first timeout of the quarter was taken by the away team. That number increased from 35.6% in Q1 to 44.3% in Q4.
Minnesota took by far the fewest 1st mandatory timeouts as the away team, only 40 out of a possible 164.
Toronto again desired to use their timeouts earlier, taking more than half of the first timeouts of the quarter as an away team (87).
In 26.5% of quarters, the same team was charged with both mandatory timeouts. This number also increased from 17.4% in Q1 to 33.8% in Q4.
Washington gets top billing here, claiming both mandatory timeouts in 86 of 164 quarters played.
Charlotte did so the fewest times, only 21.
Possession
Teams take the overwhelming majority of timeouts when they will be the next team to have an offensive possession, 86.9% overall in 2025-2026.
Mandatory timeouts are less likely to be offensive in earlier quarters, because more teams allow their timeouts to be forced. Voluntary timeouts are more likely to be defensive as the game gets later.
When chosen (not forced), timeouts precede an offensive possession 93.0% of the time.
Chicago led this category at 96.8% offensive, with Houston 30th at 86.1%.
Teams that are forced to a timeout return to the floor on offense only 49.4% of the time.
It makes sense that this tends slightly defensive since nearly every “just in time” timeout comes on an offensive possession. In the last three years, I’ve identified only 3 regular season cases of a team calling a timeout after their own made basket, the only way to get a defensive JIT timeout.
One additional note on possession. In the initial release of NBA Gamecast, I shaded timeouts that were Forced - Defense a more urgent alert color than those that were Forced - Offense with this assumption:
Timeouts are most often better for the team that is next on offense, partially because coaches can draw up after-timeout (ATO) plays.
According to pbpstats, possessions following timeouts and possessions following regular dead balls had nearly the same efficiency as far as points per possession for the three years beginning 2021-22. However, the last two years have seen a trend in favor of the defense after a timeout.
In 2024-2025, a dead ball resulted in 1.12 PPP compared to 1.10 PPP after a timeout. That gap has widened to 1.15 PPP vs 1.09 PPP after a timeout last year. It is possible that was an anomaly, but I will be watching this year to see if teams alter their strategy to take more defensive timeouts than they have previously.
Wrap-up
Ideally, this dashboard and analysis of it could answer the question “which teams use timeouts well and which teams use them poorly?” I’m not at that level of abstraction yet. However, as I dig in to the data, patterns do emerge that help to explain what a team’s timeout philosophy is, even if comparing those philosophies to one another remains a future goal.
The biggest gap is normalization for game flow. I have taken an initial look at score margin’s effect. 55.4% of timeouts are taken by the trailing team with only 40.8% taken by the leading team. Further analysis is required to more directly compare teams should they be presented with the same game state.
That story extends to the playoffs as well. For example, there are 29% fewer forfeited timeouts in the playoffs than the regular season. Although much of that difference can be attributed to having closer, more important matches.
Three-year trends at the league level do not strongly indicate patterns of strategy changes in timeout usage, but I am keeping an eye on the timing of mandatory timeouts, which have moved slightly earlier and the willingness to take both mandatory timeouts in a quarter, which has increased a small amount. Team specific trends are more visible, be it by real change (e.g., coaching turnover) or small sample bias, I’m not sure.
And finally, one extra item.3 In the last three regular seasons, there have been 10 excess timeouts called, which result in the timeout being granted, but the opposing team receiving one free throw and the ball as penalty. Memphis took two of the ten, but Indiana leads the way with three. The Pacers did so in three consecutive games November 13th - 17th, 2025, all three losses where they were trailing by 17+ in the fourth quarter and apparently had a lot to teach, even at the cost of a technical foul.
If you use the tool and find items of interest, please share them here. Thanks!
Coming Soon - Part 2: The Challenge with Challenges Returns
Teams may only carry 4 timeouts to the 4th Quarter and only 2 timeouts the final 3:00 of regulation.
And allowing for a chance to retain a timeout on a successful first challenge.
Pun intended.